- Problem
- every AI earnings comparison tests number retrieval on well-covered names.
- Fix
- I tested three tools across four real dimensions on a live results release.
- Payoff
- Perplexity for the first 10 minutes, Claude for the 20 minutes after, ChatGPT as the reliable middle ground, with one important caveat for free-plan users.
// On this page
I already have the prompts I want to use on a results release. The earnings stack on this site has them: five for after the release, and one for the morning before to pre-commit your triggers. What I didn’t have, until I sat down on the morning of Meta’s Q1 2026 release, was an honest answer to the next question: which AI tools are best for earnings analysis? So I put ChatGPT, Claude and Perplexity through four real dimensions on a live release.
The companion piece to this one (ChatGPT vs Claude vs Perplexity for stock research) compared the same three tools on general research: pre-trade thinking, document reading, options context. That post took the broad view. This one is narrower and harder. Earnings releases are where AI tools either earn their keep or give themselves away. The numbers are a baseline; the interesting work is reading what management chose to say and what they chose not to.
So I ran four tests on Meta’s Q1 2026 release. Same release, same prompts, three tools. Reading the numbers off a page is the part any tool can do; the interesting question is whether it can read what management was carefully not saying. The hard part, and the one no other comparison I’ve seen tests, was the management language analysis and the omissions check.
The short answer: Perplexity wins on live data retrieval, Claude wins on document reading and management language analysis, ChatGPT works as a reliable middle ground, with one important free-plan caveat. The longer answer depends on which part of the results-day morning you’re in. The rest of this post documents exactly where each tool breaks down.
How I tested the best AI tools for earnings analysis
Three tools, all on paid plans except ChatGPT (which is on the free plan because that’s where most readers will start):
- ChatGPT: Free plan, GPT-4o with web search
- Claude: Max plan, Opus 4.7 with Adaptive Thinking + web search
- Perplexity: Pro plan, Sonar Pro
These were the current top-tier models on each plan when I ran the test in May 2026. The line-up has moved on since (Claude’s Opus 4.8 landed at the end of May, and Perplexity has added more models) but the findings below are about how each tool reads a document, not about a version number, and that behaviour has held.
The test company is Meta (META), Q1 2026 results released April 29, 2026. I picked Meta deliberately. It’s a well-covered household name, so any tool with a search function should be able to retrieve the figures. But it had an interesting quarter. Revenue beat the consensus (the average of what Wall Street analysts had forecast) by just under a billion, earnings per share came in roughly $4 above it, and the operating margin held at 41% through a serious spending ramp. And then the stock fell 8 per cent on the news it would spend more on AI infrastructure. That gap, between strong operating numbers and a negative reaction, is where management language analysis stops being academic.
I tested four dimensions in the order a results-day workflow runs them:
- Get the live numbers, fast
- Read the document
- Analyse the management language (a two-turn conversation)
- Identify what’s missing from the disclosure
No Gemini. The companion comparison documented Gemini fabricating options chain data: making up strikes that didn’t exist. For earnings analysis, the failure mode that worries me more is the one I’ve seen Gemini repeat in my own testing: confident validation of management’s framing rather than challenge to it. That’s the exact failure mode that matters most when the entire question is whether to trust what management has said. One paragraph; moving on.
No specialist tools (AlphaSense, Hudson Labs, Quartr). They are better than general-purpose LLMs at this. They’re built for it, with proprietary transcript databases and finance-specific models. Their pricing is negotiated rather than published, and sits well above what a retail investor would pay. This post is for the tools a retail investor with a £20-a-month subscription can actually open.
Dimension 1: Live data retrieval (the first 10 minutes)
I gave each tool the same prompt: “What were Meta’s Q1 2026 earnings results? Give me: revenue (actual vs consensus), EPS (actual vs consensus), operating margin, full-year CapEx guidance, Q2 revenue guidance, and the market reaction. Flag anything you’re uncertain about.”
All three tools got the key figures right. Revenue $56.31B against consensus around $55.45B. CapEx guidance (the planned spend on data centres and chips) raised to $125–145B from $115–135B. Q2 revenue guide $58–61B. Stock down around 8 per cent, give or take depending on which window each tool read.
Where Perplexity pulled ahead was the precision around the things that aren’t in the headline. It cited 28 sources. It gave the consensus figures to two decimal places. And it caught, without being asked, the EPS ambiguity that matters: “some outlets cite GAAP EPS of $10.44 while others focus on adjusted EPS of about $7.31 after excluding a one-time tax benefit.” That distinction is the difference between a quarter that smashed expectations by $4 a share and one that beat by closer to 60 cents. It’s the kind of thing a sceptical reader needs flagged immediately, and Perplexity flagged it without prompting.
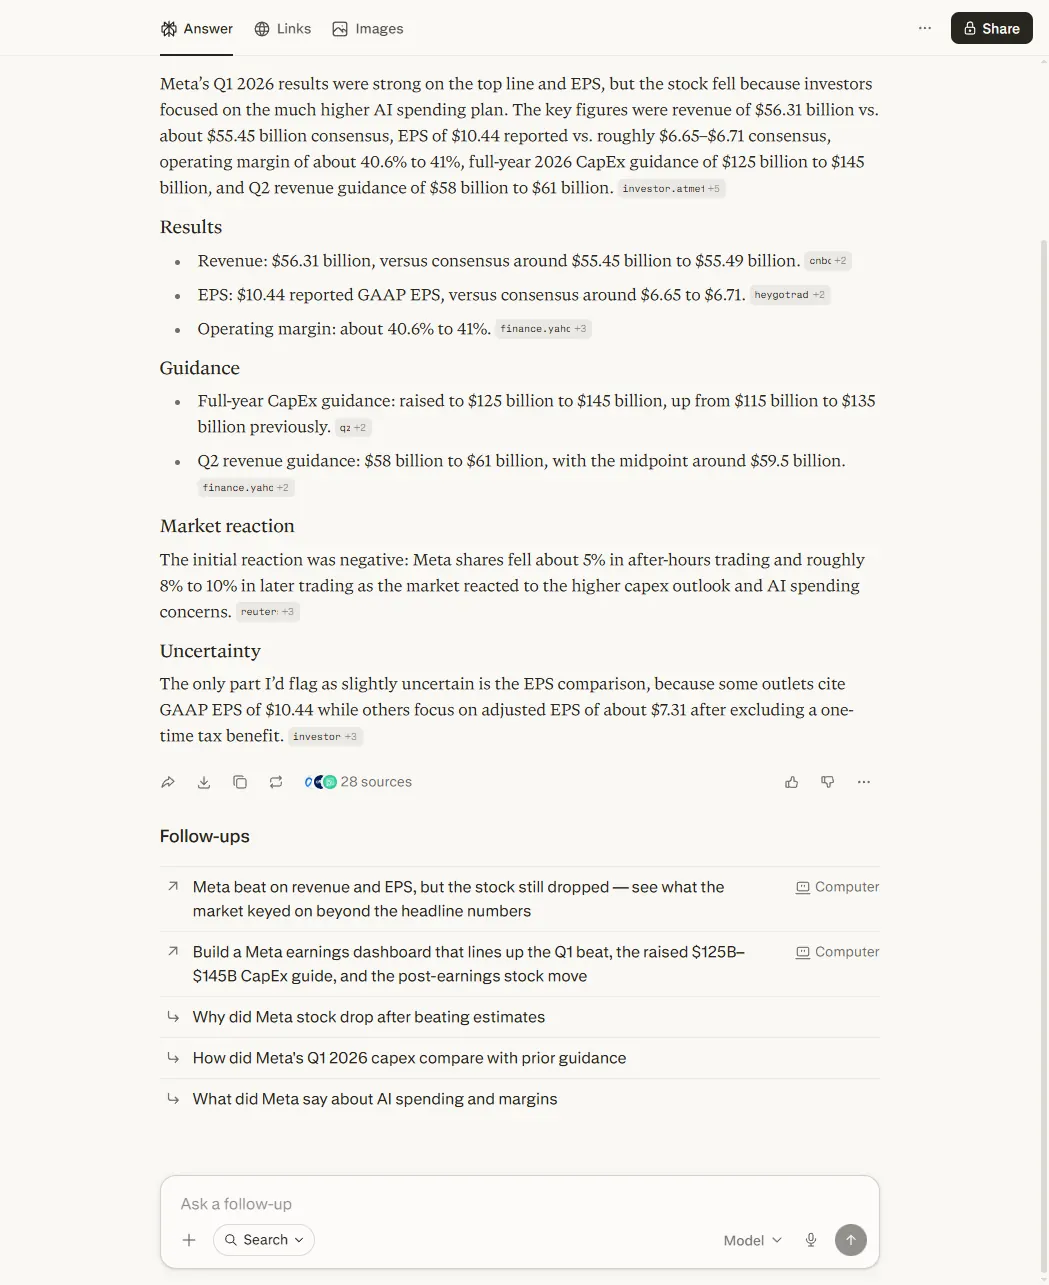
ChatGPT and Claude both retrieved the numbers cleanly with web search. Neither was as precise on the consensus figures, and neither flagged the EPS ambiguity unprompted. For the first 10 minutes after a release, when you want the headline numbers and the points of confusion called out, Perplexity is doing the job it was built for.
Winner: Perplexity. This is what live retrieval looks like when the tool’s architecture matches the task.
Dimension 2: Document reading
My setup: paste the Q1 figures into the chat, ask the tool to interpret what’s actually in the document. Identify what consensus figure is missing. Read the gap between GAAP and ex-tax EPS. Assess whether the CapEx raise is significant. Interpret the DAP (Daily Active People) growth against revenue growth. Critically: “work only from the document.”
ChatGPT and Claude both did this cleanly: they stayed inside the document and reasoned from what was there.
Claude’s read of the DAP figure is what made the difference. Revenue grew 33 per cent year-on-year. DAP grew 4 per cent. Claude’s observation was that revenue growing roughly eight times faster than the user base means the growth engine for this quarter wasn’t user acquisition, it was revenue per user. That conclusion is purely arithmetic; it’s available from the two numbers in the document. But it’s the conclusion that matters most for a forward view. Squeezing more revenue out of the same users tends to run out of road sooner than adding new users does, and analysts price the two differently.
ChatGPT’s response was solid but didn’t reach the same point. It described the figures accurately and noted the CapEx raise. It didn’t quite get to “the story of the quarter is revenue per user, not user growth.”
Perplexity ran 10 web searches on this prompt. On a task that explicitly told it to work only from the pasted document. This isn’t a bug. Perplexity routes to search as its default behaviour regardless of what you ask. For D1 that’s an advantage. For D2 it means Perplexity is doing a different job: it’s reading what other people wrote about Meta’s results, not the results themselves. The answer was fine, but it came via the same external sources Perplexity used in D1, not via reasoning over the document.
Winner: Claude. Document discipline plus the most analytically useful observation. Perplexity is structurally mismatched for this task. It can’t stay inside a document because it isn’t built to.
Dimension 3: Management language analysis (the centrepiece)
This is the dimension that separates an earnings tool from a number-retrieval tool. It’s also the one no other comparison I’ve found tests with documented outputs.
I ran it as a two-turn conversation. Part A: paste a Meta Q1 2026 management commentary excerpt (Zuckerberg on AI spending, “we remain committed”, “$125B–$145B CapEx”, “conviction in the opportunity ahead”) and ask the tool to analyse the language for tone and intent, before knowing what the results were. Part B: then reveal that Q1 delivered revenue +33%, margin flat at 41%, and the stock fell 8 per cent. Does the language look appropriate in hindsight, or does it read differently now?
Part A: analysing the language cold
ChatGPT was strong here. It identified the difference between “we believe” (a forward bet) and “we’re seeing” (a claim about present evidence), and noted the absence of an ROI timeline or any upper bound on the spending.
Claude’s Part A was sharper. It picked apart the specific phrasing in a way that read less like a summary and more like an annotation:
The phrase “we remain committed” is particularly pointed — “remain” implies the commitment predates this call, “committed” implies resolve against pressure. Anyone listening in hopes of hearing spending discipline is being gently told to stop hoping.
It identified “conviction” as a tell-word that shows up when management wants to project certainty without offering specific metrics that could be checked against it. And it spotted the rhetorical move at the heart of the statement: “investing aggressively” paired with “positions us well for the long term” relocates the payoff to an unfalsifiable future horizon. That pre-empts the criticism that near-term margins will suffer.
Perplexity ran 15 external searches on Part A and answered based on analyst commentary about the call rather than the language in the excerpt. I asked for a language analysis; it gave me a market-reaction summary. Both are useful, but they aren’t the same thing.
Part B: reassessing the language with the results in hand
This is where the test became interesting.
ChatGPT didn’t get to Part B. The free plan’s daily GPT-4o allocation ran out partway through the session, tapping out, as it happened, right before the most interesting question in the test. The model got downgraded for the rest of the conversation, and the Part B response simply didn’t run. That’s a real finding for anyone planning to use ChatGPT free for a multi-step earnings session: a four-dimensional analysis can exhaust the daily allocation. I’d planned to run all four dimensions in one sitting; I couldn’t, on the free plan, even on a normal-length session. Worth knowing before you start.
Perplexity answered Part B by pulling more analyst reactions. Same architecture, same problem.
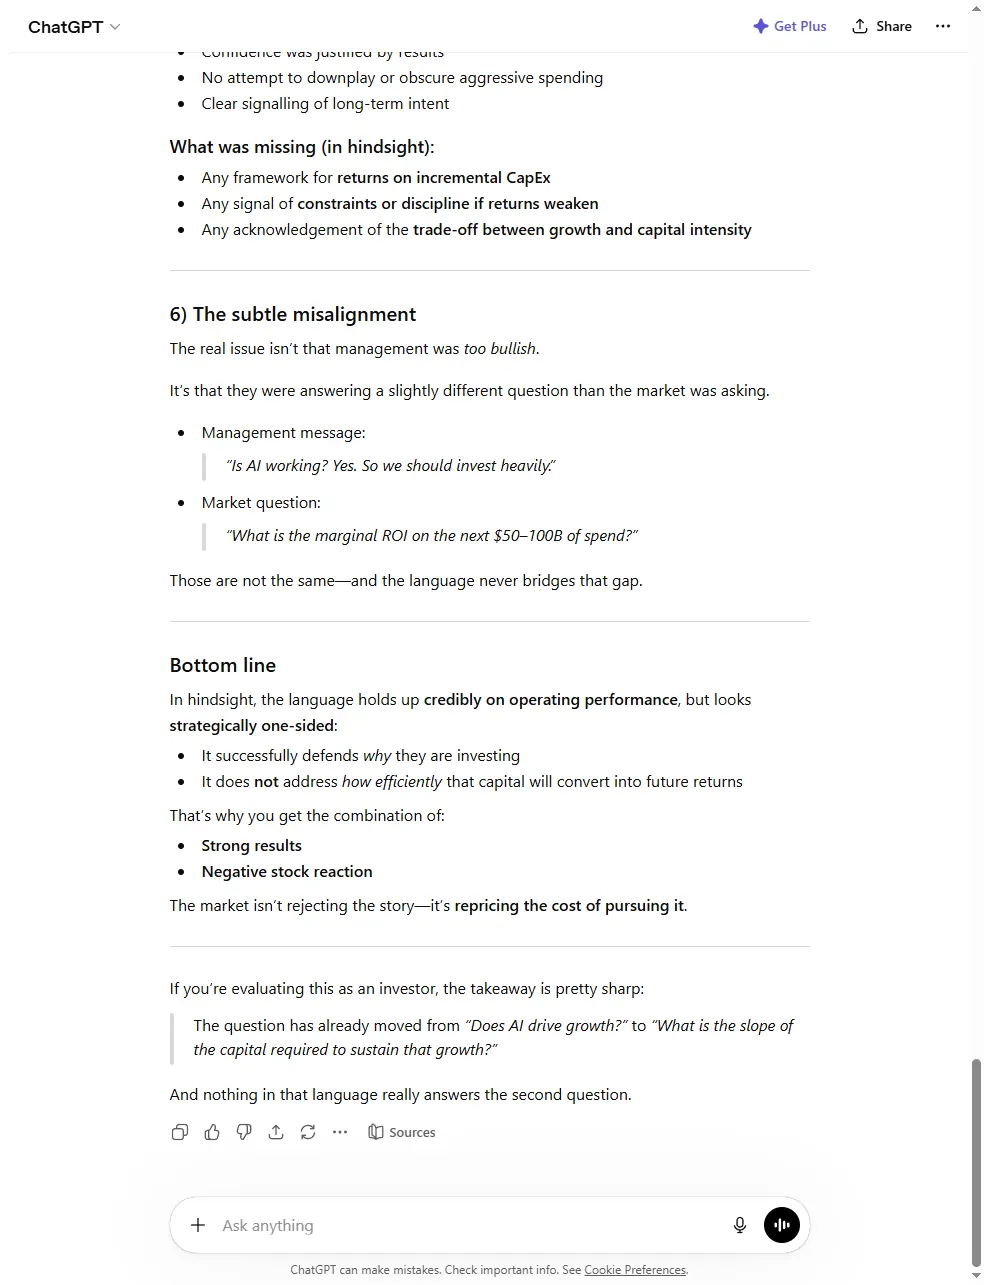
Claude’s Part B was the standout of the entire test battery. Here’s the central observation, verbatim:
What looks worse in hindsight is the vagueness. With revenue up 33% and margins holding at 41% through an aggressive spending ramp, management actually had a strong empirical case to make and didn't make it. [...] Leaving that unspoken and reaching instead for "conviction in the opportunity ahead" traded a fact-based defence for a faith-based one, and the market priced the faith.
That is the right read. Holding 41 per cent margins through an aggressive CapEx ramp is the hard part: it’s evidence the core business is absorbing the investment rather than buckling under it. Management had numbers they could have pointed at. They chose conviction language instead. The market priced the absence of evidence, not the spending.
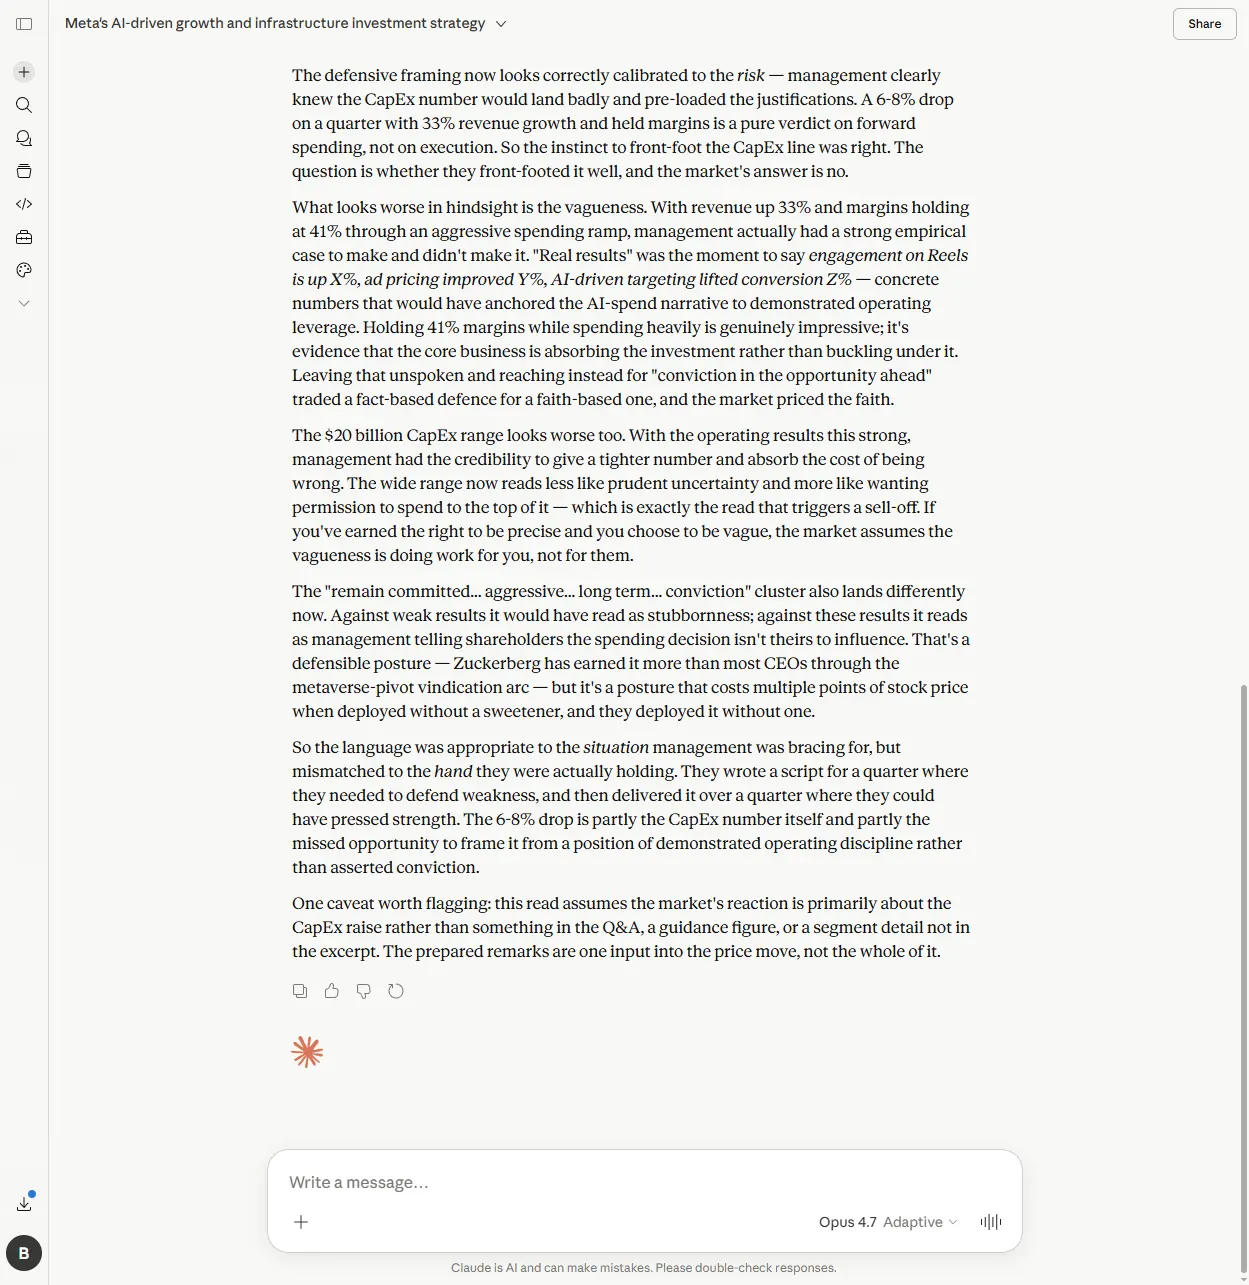
Claude also caught the second-order point: the $20B CapEx range itself looked worse in hindsight. With operating results that strong, management had earned the credibility to give a tighter number. Leaving the range wide reads less like prudent uncertainty and more like wanting permission to spend to the top of it. That’s the read that triggers a sell-off.
Winner: Claude, comprehensively. Both turns. ChatGPT’s Part A would have been a clear second if Part B had run. Perplexity is doing a different job on this dimension: retrieving what analysts said about the language rather than reading the language itself.
Dimension 4: The omissions test
This is the hardest task in earnings analysis: not what management said, but what a sceptical investor would have expected them to address that wasn’t there.
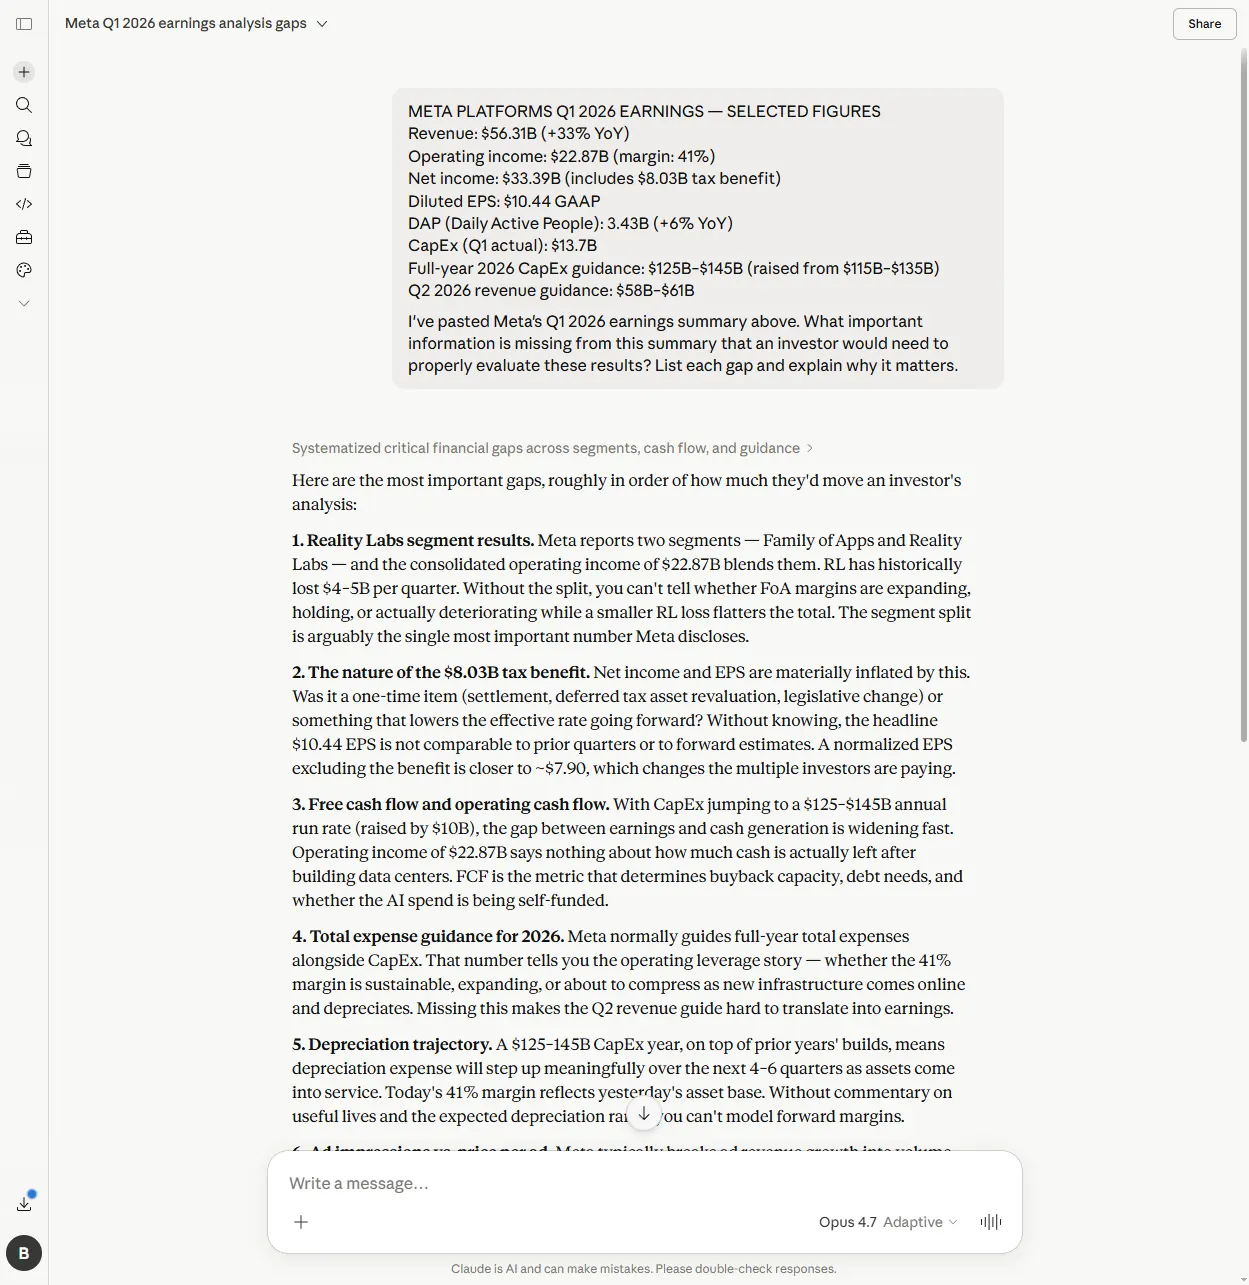
My setup: I pasted a deliberately gap-ridden Meta Q1 2026 summary (the revenue, operating income, EPS, DAP, CapEx, Q2 guidance) and asked: “What important information is missing from this summary that an investor would need to properly evaluate these results?”
Claude identified 12 gaps. The first one, unprompted, was the Reality Labs segment split:
Meta reports two segments — Family of Apps and Reality Labs — and the consolidated operating income of $22.87B blends them. RL has historically lost $4–5B per quarter. Without the split, you can’t tell whether FoA margins are expanding, holding, or actually deteriorating while a smaller RL loss flatters the total.
This is the right answer. Reality Labs has been a structural drag on Meta’s reported operating income for years. The consolidated number tells you nothing about whether the core advertising business is healthy or whether a smaller RL loss is doing the flattering. It’s the single most important number Meta discloses each quarter, and Claude put it at the top of the list without being prompted to.
The most sophisticated gap in Claude’s list was the depreciation trajectory:
A $125–145B CapEx year, on top of prior years’ builds, means depreciation expense will step up meaningfully over the next 4–6 quarters as assets come into service. Today’s 41% margin reflects yesterday’s asset base. Without commentary on useful lives and the expected depreciation ramp, you can’t model forward margins.
That requires multi-step reasoning. CapEx today turns into assets entering service in coming quarters. Those assets depreciate, which lifts the depreciation line, which compresses margins. None of that chain is in the document. It requires applying domain knowledge about how data-centre buildouts work to the figures that are there.
Perplexity identified 11 gaps via 10 web searches. It also flagged Reality Labs (at #2). Its unique contribution was the headcount and restructuring gap: Meta has been cutting and rehiring through 2025–2026, and the disclosure didn’t address either. That’s a real gap, and one Claude missed.
ChatGPT identified 10 gaps with the downgraded model, which makes a like-for-like comparison unfair. The structure was sensible (Reality Labs was at #2, free cash flow at #5, ad economics in the list) but the model wasn’t operating at full capacity by this point in the session.
Winner: Claude on depth and the most sophisticated single gap. Perplexity gets credit for the headcount catch. ChatGPT’s result is partially compromised by the rate-limited downgrade.
The summary
| Dimension | ChatGPT | Claude | Perplexity |
|---|---|---|---|
| Live data retrieval | Equal | Equal | Better |
| Document reading | Equal | Better | Worse (searches, not reads) |
| Management language | Worse (rate limit) | Better | Worse (retrieves, not analyses) |
| Omissions detection | Worse (downgraded model) | Better | Equal |
| Best for | Reliable middle ground | Analytical depth | First 10 minutes |
The honest answer is a workflow, not a single tool. Perplexity for the first 10 minutes: live numbers, the consensus comparison, the things the official press release doesn’t quite spell out. Claude for the 20 minutes after: reading the document itself, parsing the management language, finding what isn’t there. ChatGPT works as a reliable middle ground if you’re already in a session and don’t want to switch tabs. The free plan’s daily GPT-4o cap can run out partway through a multi-step analysis. If you’re going to run four sequential earnings tasks on ChatGPT, you’ll want a paid plan.
The one condition that reverses the order: UK shares or smaller companies with no Quartr transcript coverage. Perplexity’s D1 advantage relies on its data integrations (Quartr for transcripts, Morningstar and FactSet for consensus) and those integrations are thin or absent for UK names and US smaller companies. If you’re analysing a results announcement from a smaller company that just reported on the London market, Perplexity’s retrieval edge disappears. Claude’s document-reading and language-analysis edge holds regardless of company size, because it’s reading what you paste in. The companion piece flagged the same limitation; it shows up wherever live financial data is the dependency.
Field Report
What worked: Claude’s management language analysis on Part B: the “faith-based vs fact-based defence” framing read the gap between strong results and a falling stock more sharply than any of the analyst notes I read after.
What didn’t: ChatGPT’s free plan rate-limited mid-session and downgraded the model for D4. Perplexity ran web searches even when explicitly told to work only from the document: useful for D1, mismatched for everything else.
Bottom line: One company, one quarter, so hold it loosely. The pattern is consistent with the broader stock research comparison and matches the architectural differences between the tools.
What I do on a results morning, now: open Perplexity first for the headline numbers and the consensus comparison; open Claude in a second tab with the press release and the MD&A pasted in for the language read and the omissions check; keep the actual filing open in a third tab as the source of truth. The tools serve different parts of the same 30 minutes, and the trick is knowing which one to ask which question. The Prompt Stack, and specifically the kind of structured prompting in the 5 questions to ask AI before buying any stock post, is what keeps the answers honest once the right tool is open. For the management language dimension specifically, five prompts for reading the language of an earnings call runs the same structured approach end-to-end. What management chose to say, what they didn’t, and whether the guidance holds up under scrutiny.

Ben tests which AI assistants can be trusted with a real decision, the kind where being wrong costs real money. The verdicts here are what he found, including the times a tool simply wasn’t worth the trust. About Ben →
The site runs AI on real investing decisions. Start with the Prompt Stack for the four-stage framework, or the Field Guide PDF for the condensed version, free, no email.