- Problem
- a company's headline profit can include one-off boosts that make the business look better than it really did.
- Fix
- four AI prompts that pull the one-offs out first, then check the profit against the cash actually coming in.
- Payoff
- a quick check you can run on any stock you own, from its public earnings report alone.
// On this page
Ask an AI what META earned last quarter and it gives you the headline: $26.8bn. That’s the number the company leads with, and the number it most wants you to take at face value. What the business earned was closer to $18.7bn.
The $8.03bn gap was a one-off tax windfall — a backdated change to how research spending is taxed, not a single extra dollar from selling more ads. It lands once, flatters the quarter, and is gone by the next one: a good month dressed up as a good business. An AI that just reads you the headline never mentions it. An AI told to go looking finds it in seconds — and that one difference quietly changes every figure you’d build on top of it.
That’s the whole exercise here: a company’s reported profit and its real profit aren’t always the same number, and the job is getting your AI to tell you which is which before you trust it. Accountants call this a quality of earnings review — checking whether the profit is real. The full version needs an accountant’s access; the part that matters to anyone holding the stock runs on nothing but the public earnings report and four prompts, each built on the Prompt Stack. Run in order, the four build up the real picture: the first strips the profit back to what the business earned, and the other three only mean something once it has.
Prompt 1 — is the profit real, or a one-off?
Before anything else, take out the parts of the profit that won’t happen again. Tax breaks, restructuring charges, gains from selling assets, legal settlements, one-off writedowns — none of it tells you whether the business actually made money this quarter. META’s tax break is the clean example: $8.03bn that made everything downstream look better than it was.
ROLE: Act as a cautious financial analyst. I am checking whether a company’s reported net income is usable for further quality-of-earnings analysis.
FILTER: Company: [COMPANY NAME]. Quarter: [QUARTER YEAR]. Reported net income: [NET INCOME]. From the earnings release below, identify every non-recurring item — tax benefits, restructuring charges, asset-sale gains, legal settlements, one-off impairments — and state the value of each.
VERDICT: Give me adjusted net income after removing these items. Flag if it differs from the reported figure by more than 10%. [PASTE EARNINGS RELEASE TEXT]
When I pasted META’s Q1 2026 release into Claude and ran this, it named the one non-recurring item — the $8.03bn tax benefit — gave back an adjusted $18.7bn, and flagged the 30% gap against my 10% threshold without being asked twice. Good output looks like that: the line items named with values, a restated figure, not “there may be some non-recurring items.” The limit: the model reads what’s stated, it doesn’t audit the underlying. For a complicated tax structure, check the stated adjustment against the quarterly filing.
Prompt 2 — is the spending plan solid or vague?
After the profit itself, the biggest thing that moves the number is what the company plans to spend next — its capital spending, or capex, which for META means data centres and chips. Here the tell isn’t a figure — it’s vagueness. META’s guidance for 2026 spending widened to a $125–145bn band, and the width is the signal: if the company won’t commit to anything tighter than a $20bn spread, you can’t pin it down either. This is where an AI earns its place by being literal. Ask it to set this quarter’s wording against last quarter’s and it will flag a forecast quietly getting looser — a floor creeping up, a firm number softening into a range — which is easy to miss reading either quarter on its own. I hold META, and that top-end figure is the one I’m now watching.
ROLE: Act as a risk-first analyst. I am checking whether capex guidance is specific enough to anchor a free-cash-flow estimate.
FILTER: Company: [COMPANY NAME]. Current capex guidance: [RANGE OR FIGURE]. Prior quarter’s capex guidance: [PRIOR RANGE OR FIGURE].
RISK: Has the band widened? Has the floor risen? Has the language moved from a firm number to a range, or from a range to qualitative wording? Name the change precisely.
VERDICT: One sentence on whether this gives an investor a usable free-cash-flow floor, or leaves the trajectory undetermined.
What the model can’t tell you is whether the wide band is honest uncertainty about how much AI infrastructure will cost, or management keeping its options open. That judgement is yours.
If management can't pin the number to within $20bn, you can't either.
This is the numbers side of the earnings-call red flags: that post reads the language; this one reads the guidance figure.
// Want the next test in your inbox? Join the newsletter.
Prompt 3 — is the profit backed by real cash?
This is the check that does the most work: is the reported profit actually backed by cash? You divide the cash the business took in — its operating cash flow — by the profit. Above 1.0x and the profit is backed by real cash coming in the door; below 0.8x and a chunk of it is on-paper profit that hasn’t turned into cash. A number that falls four quarters running, even from a healthy level, is worth a closer look.
Here’s where stripping first earns its place. META’s headline ratio is $32.23bn of operating cash flow over $26.8bn of net income — 1.20x. Fine, on the face of it. Run it on the adjusted $18.7bn instead and you get 1.72x. The stripped figure looks stronger, not weaker — because the tax benefit had inflated net income, the bottom of the fraction, so taking it back out makes the ratio climb. That’s the opposite of what you’d expect, and the whole reason the order matters: here a one-off made the business look worse than it was, but the distortion runs both ways — elsewhere an undisclosed gain could make a shaky company look solid.
When I pasted the Q1 release into Claude (Fable 5) and ran the strip prompt, then handed it the cash flow figures, it returned 1.72x — and it used the adjusted $18.7bn, not the headline $26.8bn. Then it did the thing I didn’t ask for: it noted the unadjusted ratio would have been 1.20x and that the verdict “isn’t sensitive to the tax adjustment” either way. That’s the reasoning chain the whole post is built on — strip first, then ratio — and it ran it without being walked through it.
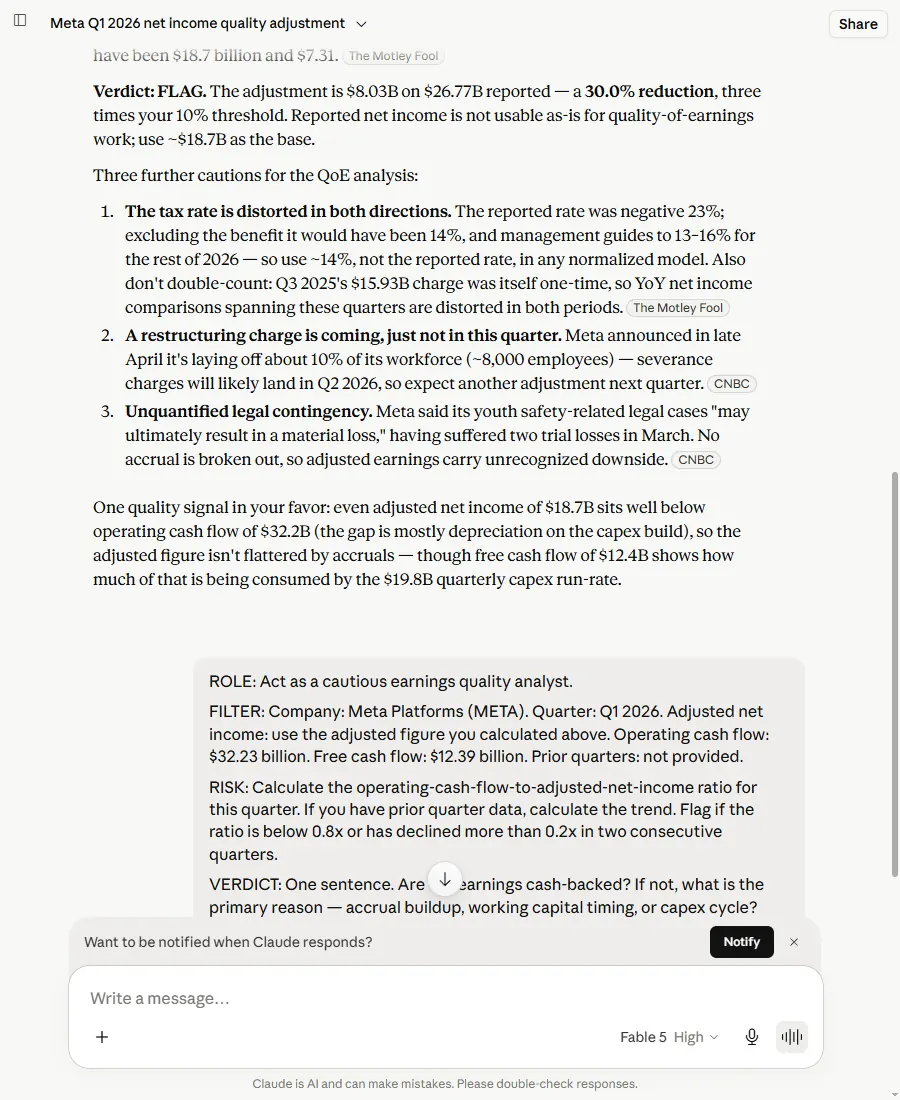
ROLE: Act as a cautious earnings-quality analyst.
FILTER: Company: [COMPANY NAME]. Quarter: [QUARTER]. Adjusted net income [after the strip in Prompt 1]: [FIGURE]. Operating cash flow: [FIGURE]. Free cash flow: [FIGURE]. Prior three quarters’ figures: [IF AVAILABLE].
RISK: Calculate operating cash flow divided by adjusted net income for this quarter, and the trend if you have prior data. Flag if the ratio is below 0.8x or has fallen more than 0.2x across two quarters.
VERDICT: One sentence. Are the earnings cash-backed? If not, is the cause accrual buildup, working-capital timing, or the capex cycle?
You want a stated ratio with a named cause, not “the company has strong cash generation.” Apple is the useful contrast: Q2 2026 operating cash flow of $28.7bn against net income of $29.6bn is 0.97x — just under, which looks soft until you see Q1 ran at 1.28x. A high-quality business having a seasonally quiet quarter, not a deteriorating one. That difference is the contextual read an AI does well, given the prior quarters to compare.
Prompt 4 — did the profit story actually change?
Last, the profit margin — but not just whether it went up or down. The question is whether the reason it held up will last. A margin propped up by the business growing faster than its costs is durable; one propped up by a single quarter of job cuts is borrowed from the next. META kept a 41% margin even as costs rose 35% in a year, and the shares I hold still dropped 8.6% — not on the margin it reported, but on the margin it could keep once it’s spending $145bn on data centres.
The story shifted from "improving" to "capped by the infrastructure cycle" in a single call.
ROLE: Act as a cautious analyst reviewing operating-margin quality.
FILTER: Company: [COMPANY NAME]. Quarter: [QUARTER]. Operating margin: [FIGURE]. Prior quarter: [FIGURE]. Year ago: [FIGURE]. From the management discussion below, name the main stated driver of the change — revenue-over-cost growth, cost reduction, mix shift, or a one-off.
RISK: If the driver is temporary, or depends on capex staying suppressed, say so.
VERDICT: One sentence. Is this margin a reliable baseline for forward modelling, or does the commentary suggest it reverts? [PASTE MANAGEMENT DISCUSSION]
What this AI quality of earnings review doesn’t cover
The four prompts run on what’s in the earnings report. They don’t touch what needs professional access — how long customers are taking to pay (receivables ageing), how much of the revenue rests on a handful of big customers, a management interview. They also skip working-capital trends — how fast cash comes in versus goes out — which need the full balance sheet in the annual filing, not the quarterly report. And the framework assumes a normal operating business: I wouldn’t run it on BMNR, which I hold — its earnings are a bet on the price of Ethereum, not operating profit you can strip and check.
This review is the numbers half of a wider set of earnings-call prompts, and the third move in a sequence: run the pre-trade earnings prompt the morning before the call, read the red flags in the language as management speaks, then run this quality-of-earnings pass on the numbers once the release lands.
The low reading is the part people misread.
A reading below 0.8x doesn't mean sell; it means ask what changed.
And the four prompts above are how you find out, in the right order, before the number talks you into anything.
Field Report
What worked: The strip in Prompt 1 is the load-bearing step. Run the cash check on the unstripped profit and you can get the story backwards, as META’s headline 1.20x versus adjusted 1.72x shows. The AI did the extraction and the arithmetic without being walked through the order.
What didn’t: It does the numbers, not the judgement — it can’t tell you whether a wide capex band is honest uncertainty or management keeping its options open. That call stays yours.
Bottom line: A quarterly habit worth keeping on a stock you already hold; no use at all on a company whose earnings aren’t operating earnings to begin with.

Ben tests ways of getting reliable answers from AI on his own investing — documenting what each model got wrong, what each one caught, and the prompts that survived the cuts. About Ben →
The site runs AI on real investing decisions. Start with the Prompt Stack for the four-stage framework, or the Field Guide PDF for the condensed version — free, no email.